Creating Custom Shapes by Function
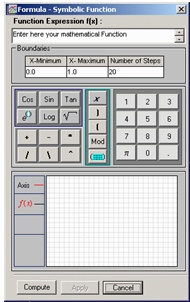
Use this option to create a custom shape having one of its borders represented by an approximation of a mathematical function. The Formula dialog is displayed.

Enter the function of x expression in the Function Expression f(x) textbox. For example:
5 + Sin(x*PI/2)
Enter the left and right limit of the function in the X-Minimum and X-Maximum textboxes. For example: 0.0, 1.0.
The shape border is approximated by evaluating the function at fixed x intervals between the specified limits and joining the point with line segments. The Number of Steps indicates how many line segments will be used.
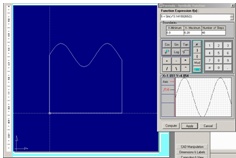
Click Compute to get a preview of the approximation. If you are satisfied with the approximation, click Accept to commit the new shape to the drawing area. Note that the committed shape’s borders are specified by:
| 1) | y = f(x) between X-Minimum and X-Maximum |
| 2) | x = X-Minimum between y = 0 and y = f(X-Minimum) |
| 3) | y = 0 between X-Minimum and X-Maximum |
| 4) | x = X-Maximum between y = 0 and y = f(X-Maximum) |
The new shape’s label is set to the function expression.
For example, the function: gives:

Note: A shape created using this method is generally modified once committed to the drawing area.